1. Graphviz介绍
Graphviz 是一款由 AT&T Research 和 Lucent Bell 实验室开源的可视化图形工具,可以很方便的用来绘制结构化的图形网络,支持多种格式输出。
Graphviz 的输入是一个用 dot 语言编写的绘图脚本,通过对输入脚本的解析,分析出其中的点、边及子图,然后根据属性进行绘制。
访问官网,下载对exe安装文件(如: stable_windows_10_cmake_Release_x64_graphviz-install-2.47.1-win64.exe),安装时选择“添加系统path”选项。
1.1 使用dot语言
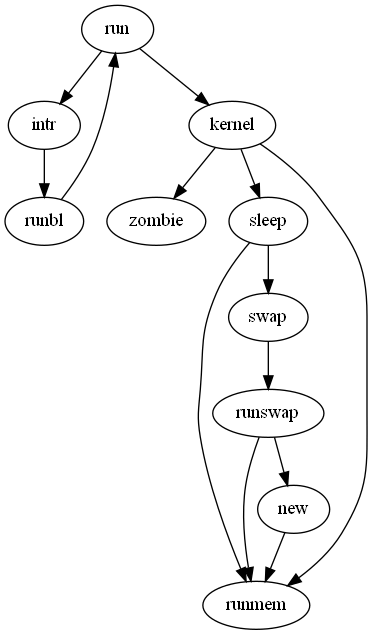
main文本内容:
digraph {
	run -> intr
	intr -> runbl
	runbl -> run
	run -> kernel
	kernel -> zombie
	kernel -> sleep
	kernel -> runmem
	sleep -> swap
	swap -> runswap
	runswap -> new
	runswap -> runmem
	new -> runmem
	sleep -> runmem
}
使用dot进行编译:
dot main -Tpng -o main_c.png

main_c.png图像,如下:

关于dot语言的更多使用方法,可访问官网文档。
1.2 支持python平台
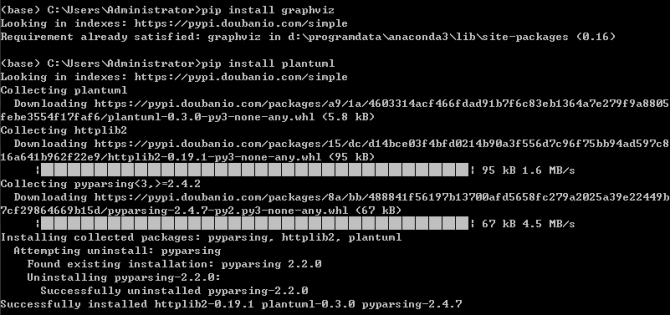
Graphviz也支持python平台,安装此模块指令如下:
pip install graphviz
main.py 代码内容,如下:
# -*- coding: utf-8 -*-
"""
Created on Sat May 15 12:17:32 2021

@author: Administrator
"""

from graphviz import Digraph

# 函数API文档:https://graphviz.readthedocs.io/en/stable/api.html

'''
class graphviz.Digraph(name=None, comment=None, filename=None, directory=None,\
                       format=None, engine=None, encoding='utf-8', graph_attr=None,\
                           node_attr=None, edge_attr=None, body=None, strict=False)[source]
Directed graph source code in the DOT language.

Parameters:
    name – Graph name used in the source code.
    comment – Comment added to the first line of the source.
    filename – Filename for saving the source (defaults to name + '.gv').
    directory – (Sub)directory for source saving and rendering.
    format – Rendering output format ('pdf', 'png', …).
    engine – Layout command used ('dot', 'neato', …).
    encoding – Encoding for saving the source.
    graph_attr – Mapping of (attribute, value) pairs for the graph.
    node_attr – Mapping of (attribute, value) pairs set for all nodes.
    edge_attr – Mapping of (attribute, value) pairs set for all edges.
    body – Iterable of verbatim lines to add to the graph body.
    strict (bool) – Rendering should merge multi-edges.
'''
g = Digraph(filename='main', format='png', engine='dot')

g.edge('run', 'intr')
g.edge('intr', 'runbl')
g.edge('runbl', 'run')
g.edge('run', 'kernel')
g.edge('kernel', 'zombie')
g.edge('kernel', 'sleep')
g.edge('kernel', 'runmem')
g.edge('sleep', 'swap')
g.edge('swap', 'runswap')
g.edge('runswap', 'new')
g.edge('runswap', 'runmem')
g.edge('new', 'runmem')
g.edge('sleep', 'runmem')

g.view()
执行main.py,输出图像 main.png,如下:
2. PlantUML介绍
PlantUML 是一个开源项目,支持快速绘制图形,如:时序图、用例图、类图、对象图、活动图、组件图、部署图、状态图、定时图;同时,还支持非 UML 图,如:JSON Data、YAML Data、Network diagram (nwdiag)、线框图形界面、甘特图等。
2.1 支持python
plantuml也支持python平台,安装模块指令,如下:
pip install plantuml
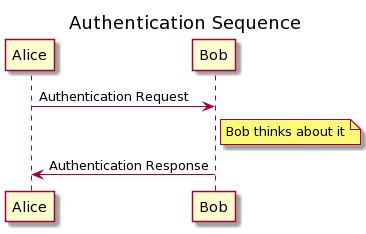
(1)main.txt 内容
@startuml
title Authentication Sequence

Alice->Bob: Authentication Request
note right of Bob: Bob thinks about it
Bob->Alice: Authentication Response
@enduml
(2)运行python指令
python -m plantuml main.txt

(3)生成图像
2.2 支持java
因为python接口函数需要调用默认URL服务器,因此必须保证联网。
若采用JAVA环境开发,可直接下载 plantuml.jar,并离线运行生成指令。
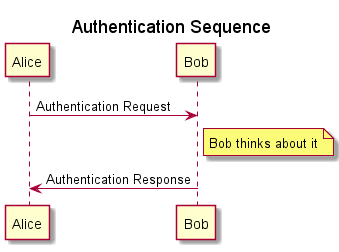
(1) main.txt 内容

@startuml
title Authentication Sequence

Alice->Bob: Authentication Request
note right of Bob: Bob thinks about it
Bob->Alice: Authentication Response
@enduml
(2)运行java指令
java -jar plantuml.jar main.txt

(3)生成图像
参考来源: